Meet Cattlytics at NCBA’s CattleCon 2026 , Booth 944. Book Now
A 6,500-head California dairy operation running three separate management systems had zero enterprise-level visibility into operational performance. When financing requirements forced data consolidation, the migration process revealed $320,000 in annual hidden costs across feed inefficiency, reproductive gaps, labor duplication, and inconsistent health protocols. Within 6-12 months of unified deployment, validated improvements in pregnancy rates, feed cost alignment, and labor efficiency confirmed the discovery and delivered measurable ROI.
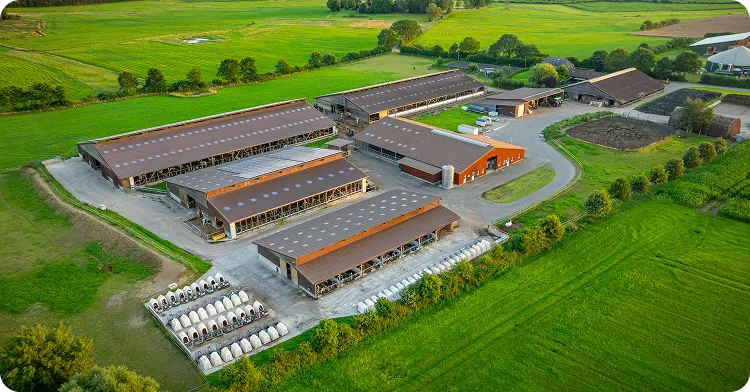
For a multi-site dairy operation in California's Central Valley managing 6,500 head across three dairies, the numbers should have told a clear story. They didn't. Each location ran its own herd management software. Each site manager reported performance differently. And when the board asked basic questions about enterprise-wide productivity, the answers didn't exist.
"We had three dairies, three software systems, and three versions of the truth," said the Operations Director. "When our CFO asked which sites were hitting pregnancy rate targets, I realized we couldn't actually answer that question. Each manager was reporting numbers differently, and we had no way to verify who was right."
The operation wasn't failing. But without consolidated data, leadership had no way to know where the problems actually were, or how much they were costing.The three-site structure reflected organic growth.

"When corporate asked me to explain why our feed costs were $0.85 per cwt lower than Dairy 3, I had no idea," said the Site Manager at Dairy 1, who had managed the operation for 12 years. "We were all supposedly feeding the same ration, but the data wasn't talking to each other."
Monthly KPI reporting consumed 14 hours of manual reconciliation. The nutritionist couldn't compare total mixed ration execution across sites. And when the lender asked for consolidated performance metrics to support refinancing, the operation couldn't produce them."Our lender flat-out told us they needed enterprise-level KPIs or the refinancing wasn't happening," the CFO recalled. "That's when we realized fragmentation wasn't just inconvenient, it was blocking our ability to operate as a business."
The fragmentation had reached a breaking point.The rollout followed a 15-day phased approach: data extraction, validation, parallel run, and cutover to the unified dairy herd management platform. What happened during those first three months changed how the operation understood its own business.

As data consolidated, patterns emerged that had been invisible when siloed. The revelation wasn't about better reporting; it was discovering problems nobody knew existed. The hidden costs fell into five categories:
Dairy 3's feed costs weren't just higher, they were 18% above Dairy 1 for what was supposed to be the same ration. TMR mixing inconsistencies, untracked shrinkage at the feed bunk, and zero coordination on bulk purchasing meant the operation was hemorrhaging money on feed.
"When we finally had all three sites in one system, I could see the feed delivery reports side by side for the first time," the Nutritionist explained. "Dairy 3 was consistently 8-12% over on feed shrink compared to Dairy 1, and nobody had caught it because each site was reporting separately. That's real money walking out the door every single day."
The seven-point pregnancy rate gap between Dairy 1 and Dairy 3 hadn't been a mystery; it had been invisible. Consolidated breeding records revealed that Dairy 2 and Dairy 3 had never implemented systematic heat detection protocols. They were relying on visual observation during feeding times, missing cycles, and extending days open.

"The data migration itself revealed issues they didn't know existed," said the Cattlytics Implementation Specialist. "As we consolidated breeding records, we discovered Dairy 2 and Dairy 3 had never implemented systematic heat detection; they were relying on visual observation. That 7-point pregnancy rate gap wasn't a mystery anymore. The unified data told the story immediately."
Three separate data systems meant three separate workflows and manual reconciliation. The Operations Director spent a third of her time gathering information instead of acting on it.
Without standardized treatment protocols across sites, each dairy maintained duplicate drug inventories with no centralized inventory tracking, tracked withdrawal periods differently, and approached mastitis treatment with site-specific protocols. The waste was modest compared to feed and reproduction, but entirely preventable.

The operation hadn't been failing. It had been flying blind.
Discovery is one thing. Validation is another. Over the next 6-12 months, the operation proved that the $320,000 wasn't a data artifact; it was real money that could be recovered.
By month six, centralized purchasing and improved TMR consistency brought feed costs within $0.35 per hundredweight across all three dairies. Dairy 3 adopted the heat detection protocols from Dairy 1. Activity monitoring rolled out across all sites.
Pregnancy rates climbed: Dairy 3 moved from 17% to 21%, Dairy 2 from 20% to 23%, and Dairy 1 improved from 24% to 26%. Days open dropped by an average of 18 days across the poorest-performing sites.
"Six months in, our feed costs across all three sites were within 35 cents per cwt of each other," the Operations Director said. "That had never happened before. We finally had the visibility to see not just what each site was spending, but why, and we could actually fix it. That's a $137,000 annual difference that we were just missing before because the data was siloed."
"I used to spend Monday mornings chasing down numbers from three different systems," said the Site Manager at Dairy 2. "Now I spend that time looking at what the data is telling us we need to fix. That shift from reporting to responding, that's the real ROI."
| Metric | Before (Fragmented) | After (Unified) | Improvement |
| Pregnancy Rate Range | 17% – 24% (7-point variance) | 21% – 26% (5-point variance) | Variance reduced 29% |
| Feed Cost per cwt Range | $5.12 – $6.04 ($0.92 variance) | $5.28 – $5.63 ($0.35 variance) | Variance reduced 62% |
| Monthly KPI Reporting Time | 14 hours | 35 minutes | 96% time reduction |
| Days Open (Average) | 128 days | 110 days | 18-day improvement |
| Hidden Cost Discovery | Unknown/Invisible | $320K annually quantified | 100% visibility gained |
| Multi-Site Data Visibility | None (3 separate systems) | Complete (unified platform) | Enterprise-level control |
The $320,000 was validated. But the strategic impact ran deeper. Decision-making velocity went from "5-10 days just to agree on the problem" to same-day visibility across all three sites. When the board discussed acquiring a fourth dairy, they now had the data infrastructure to evaluate whether it would improve or dilute overall performance.
Benchmarking became possible for the first time. The operation could identify what was working at Dairy 1 and systematically replicate it at Dairy 3. Best practices weren't locked in managers' heads; they were visible in the data and deployable enterprise-wide.

"The $320,000 was real money, but the bigger win was operational control," the Operations Director reflected. "We can now benchmark our sites against each other, identify what's working at Dairy 1, and replicate it at Dairy 3. We're not flying blind anymore. That's worth more than the cost savings; it's the foundation for everything we're building next."


50% Off During CattleCon Week. Save Before CattleCon Ends. Valid until February 5