
Feed is your highest controllable cost. On most beef operations, it runs between 50–70% of total production expense, and that percentage climbs even higher when grain prices spike. In feedlot settings, a 10% improvement in feed efficiency across the sector would cut annual feed costs by over a billion dollars.
Small efficiency changes compound fast; across days on feed, across lactations, across your entire herd. The difference between a 5.5 and a 6.5 feed conversion ratio isn’t just a number on a report; it’s real money leaving your operation every day.
By the end of this guide, you’ll know how to calculate feed efficiency, benchmark it against your system, and build a practical improvement plan that moves the needle where it matters most: your bottom line.
What Feed Efficiency Really Means and Why It’s Often Misunderstood
Feed efficiency measures how well your cattle convert feed into product. The concept is straightforward: output divided by input. But here’s where confusion starts: “product” changes depending on your system. For finishing cattle, product means pounds of gain, but for dairy, it’s milk (usually energy-corrected). For cow-calf operations, it might be pounds of calf weaned per unit of feed consumed by the cow.
The inverse metric, feed conversion ratio, flips the equation: input divided by output. Lower is better because it means less feed required per unit of gain. Both metrics describe the same relationship, just from different angles.
Why It Matters for Profit
Two steers can post identical average daily gains but deliver very different returns. The difference? Intake. If Steer A gains 3.5 lb/day on 21 lb of dry matter while Steer B gains the same on 28 lb, Steer B costs you roughly $0.59 more per day at typical feed prices. Over a 200-day feeding period, that’s $118 per head in extra feed cost for the same performance, a gap that directly erodes margin.
Feed efficiency connects biology to economics. When you track cattle records and performance data across animals, you can identify which ones deliver profitably versus which ones just gain weight.
The #1 Confusion: As-Fed vs Dry Matter
Water content varies wildly across feedstuffs. Silage might run 65% moisture while dry hay sits at 12%. Comparing feed efficiency using as-fed weights creates misleading numbers. So, always calculate efficiency on a dry matter basis. It’s the only way to get an accurate, comparable picture of what your cattle actually consume.
The Main Feed Efficiency Metrics
FCR, G: F, ECM/DMI, and RFI each serve different purposes. Know which metric fits your operation so you’re measuring what actually drives decisions.
FCR / Feed-to-Gain (F: G) and Gain-to-Feed (G: F)
Feed conversion ratio (FCR), also called feed-to-gain (F :G), is the most common metric in beef operations. It’s calculated as pounds of dry matter intake divided by pounds of live weight gain. A typical range for feedlot cattle runs 4.5 to 7.5, with lower numbers indicating more efficient conversion.
Gain-to-feed (G: F) simply inverts the ratio. Instead of 6:1 (requiring 6 lb feed per 1 lb gain), you’d express it as 0.167 (gaining 0.167 lb per lb of feed). Higher G: F values are better. Scientific literature often reports G: F, while practical feedlot settings typically use FCR because “6 pounds of feed to make a pound of gain” communicates more intuitively during pen checks and ration decisions.
The critical requirement: measure intake on a dry matter basis. Without DM conversion, your numbers compare apples to oranges and lead to poor decisions.
Feed Conversion Efficiency (FCE)
Feed conversion efficiency (FCE) answers the question every producer asks: “How much feed does it take to put on a pound?” It’s the same calculation as FCR, expressed as pounds of dry matter feed per pound of gain. The value of FCE lies in its direct translation to cost. Multiply FCE by your ration cost per pound of DM, and you get the cost per pound of gain. That’s a number you can act on.
ECM/DMI
For dairy operations, the standard efficiency metric is energy-corrected milk divided by dry matter intake (ECM/DMI). It accounts for differences in milk fat and protein content, providing a standardized comparison. Typical values range from 1.3 to 1.8, depending onthe lactation stage.
Here’s the caution: a cow showing very high ECM/DMI may be mobilizing excessive body reserves to support milk production. That “borrowed energy” inflates the ratio but isn’t sustainable and can compromise reproduction and health downstream.
Residual Feed Intake (RFI)
Residual feed intake measures how much an animal actually eats compared to what’s predicted based on its body weight and growth rate. A negative RFI indicates the animal consumed less than expected, it’s more efficient. RFI is valuable for genetic selection because it identifies efficiency independent of size or growth rate. The challenge? You need individual animal intake data, which requires specialized equipment. For most commercial operations, RFI is a breeding decision tool rather than a day-to-day management metric.
Metric Comparison Cheat Sheet:
| Metric | Formula | Unit | Better | Best Use |
| FCR (F:G) | DMI ÷ ADG | lb feed/lb gain | Lower | Feedlot monitoring |
| G:F | ADG ÷ DMI | lb gain/lb feed | Higher | Research, genetics |
| FCE | lb DM per lb gain | lb/lb | Lower | Cost calculations |
| ECM/DMI | ECM ÷ DMI | ratio | Higher* | Dairy evaluation |
| RFI | Actual – Expected | lb DM/day | Lower (neg) | Genetic selection |
Feed Efficiency Formula and How to Calculate It Correctly
Accurate calculations require dry matter intake, consistent weights, and realistic time windows. Get the data right first as bad inputs create expensive false signals.
The Minimum Data You Need
To calculate feed efficiency, you need four core data points: dry matter intake, total days on feed, start and end weights, and average daily gain. From there, add the ration cost per pound of DM to convert efficiency into economics.
Nice-to-have data improves interpretation: health pulls and treatment days, weather events, bunk calls and refusals, and any sorting or re-penning. These contextual factors explain why efficiency might shift week to week and prevent you from chasing false signals. Digital record systems that capture this data alongside performance metrics give you the complete picture.
Step-by-Step Feed Efficiency Calculation Example
Walk through real beef and dairy calculations that convert raw numbers into actionable cost-per-pound figures. See exactly how FCR translates to dollars per head.
Beef Example:
A pen of finishing steers shows the following over a 60-day period:
• Total feed delivered: 132,000 lb as-fed (at 88% DM) = 116,160 lb DM
• Head count: 100 steers
• DMI per head per day: 116,160 ÷ 100 ÷ 60 = 19.36 lb/hd/day
• Average start weight: 950 lb; Average end weight: 1,160 lb
• Total gain: 210 lb; ADG: 210 ÷ 60 = 3.5 lb/day
• FCR: 19.36 ÷ 3.5 = 5.53
To convert to cost per pound of gain:
• Ration cost: $0.12 per lb DM
• Cost per lb gain: 5.53 × $0.12 = $0.66
Dairy Conceptual Example:
A mature cow produces 85 lb of 4.0% fat, 3.2% protein milk daily on 55 lb DMI:
• ECM formula: (0.327 × milk lb) + (12.95 × fat lb) + (7.2 × protein lb)
• ECM: (0.327 × 85) + (12.95 × 3.4) + (7.2 × 2.72) = 91.4 lb ECM
• ECM/DMI: 91.4 ÷ 55 = 1.66
Common Calculation Mistakes That Create Fake “Wins”
The most frequent error: using as-fed weights instead of dry matter. A ration heavy in silage looks like it delivers better efficiency simply because you’re comparing water-diluted intake to actual gain.
Other pitfalls include inconsistent weighing protocols, measurement windows too short to smooth daily variation, and ignoring body condition change in dairy cows. A cow losing a body condition score while maintaining high ECM/DMI isn’t efficient; she’s depleting reserves.
Feed Efficiency Benchmarks by Cattle System
Feedlot, cow-calf, and dairy operations each have different efficiency targets. Use these benchmarks to spot underperformers and set realistic improvement goals.
Feedlot / Finishing Beef
For feedlot cattle on high-energy finishing rations, FCR typically falls between 4.5 and 7.5, with most operations targeting below 6.0. But raw FCR doesn’t tell the whole story. Compare two steers finishing in 180 days at identical weights: if one converts at 5.5:1 and the other at 6.5:1, the less efficient animal consumes roughly 360 more pounds of feed over that period.
So, it will potentially add $40–50 cost per head, depending on ration price. Use health and treatment tracking to identify whether pulls and morbidity are dragging pen-level efficiency down.
Cow-Calf + Stocker/Backgrounding
In cow-calf systems, roughly 70% of feed resources go to the cowherd, and about 70% of that is maintenance. That means nearly half of all feed in beef production simply maintains breeding females. Here, efficiency metrics shift toward pounds of calf weaned per cow exposed, or cow maintenance cost relative to calf value.
For stockers and backgrounders on forage-based programs, expect FCR in the 6–10 range depending on forage quality. Consistent measurement windows matter; comparing 30-day segments against each other reveals seasonal and forage-quality effects.
Dairy
For Dairy operations, target ECM/DMI values vary by group:
- High group (mature cows): >1.7
- High group (first lactation): >1.6
- Low group: >1.2;
- One-group TMR: >1.5
- Fresh cows (<21 DIM): <1.5 (expected due to lag in intake)
- Concern threshold: <1.3
Fresh cows showing efficiency above 1.5 may be mobilizing too much body fat. So, watch body condition scores alongside ECM/DMI to catch problems before they compound into reproduction issues.
The 5 Biggest Levers That Move Feed Efficiency
Feed quality, ration design, intake consistency, health management, and genetics offer the highest ROI. Fix these levers before chasing marginal gains elsewhere.
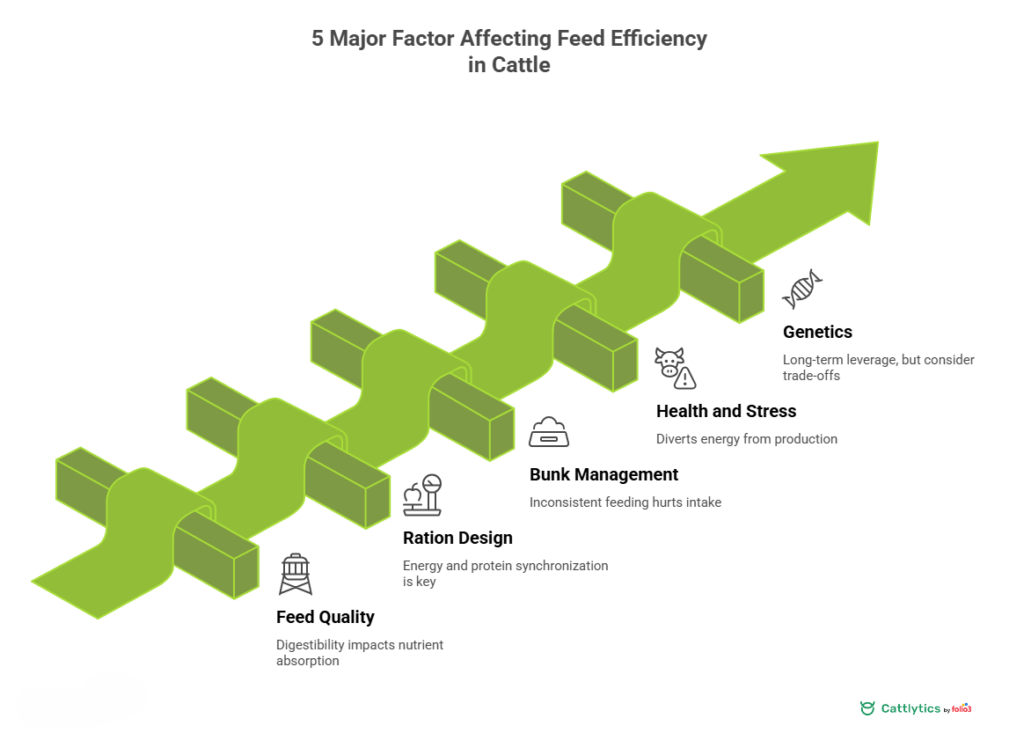
Feed Quality and Digestibility
Digestibility drives efficiency more than any other single factor. Two rations can look identical on paper, same crude protein, same energy density, yet perform differently because of forage maturity, processing quality, or mycotoxin load. Corn silage harvested at optimal moisture and properly processed releases more starch for rumen fermentation than silage that’s too dry or under-processed.
Consistency matters just as much. Day-to-day variation in the bunk forces cattle to constantly adapt, which wastes energy and suppresses intake. Test forages regularly and adjust rations when quality shifts.
Ration Design + Feed Processing
Grain processing illustrates how physical form affects efficiency. Steam-flaked corn improves starch availability compared to dry-rolled corn, often improving FCR by 5–10% in finishing rations. But processing is only part of the equation; synchronizing energy and protein release in the rumen optimizes microbial growth and nutrient capture.
Work with your nutritionist to balance ration design against cost. The most digestible ration isn’t always the most profitable one.
Bunk Management, Feeding Frequency, Water Access
Cattle thrive on routine. Erratic feeding times, empty bunks, or inconsistent feed delivery trigger intake swings that hurt efficiency. Signs of intake instability include slug feeding (cattle gorging when feed finally arrives), excessive sorting, and a higher incidence of digestive upset.
Water access is equally critical as cattle need 1–2 gallons of water per pound of dry matter consumed. Inadequate or poorly located water tanks suppress intake and amplify heat stress effects. Task management systems help crews maintain consistent feeding schedules across shifts.
Health, Stress, and Environment
Every health event diverts energy from production to immune response. A single respiratory pull can set an animal back 10–14 days of gain while feed costs continue. Heat stress suppresses intake while increasing maintenance requirements with a double hit to efficiency.
Price these factors into your efficiency analysis. If a pen shows poor FCR during a period with multiple pulls or extreme heat, the metric reflects management challenges rather than genetic potential or ration failure.
Genetics and Selection
Selecting for feed efficiency through RFI or related indexes offers long-term leverage. Low-RFI cattle (more efficient) consume less feed for the same performance, and the trait is moderately heritable. Breed associations now include feed intake and efficiency metrics in their genetic evaluations.
The caution: don’t select for efficiency in isolation. Research is ongoing, but some studies suggest potential trade-offs with fertility or cow longevity in certain populations. Breeding and pedigree tracking help you evaluate genetic decisions across generations.
Making Feed Efficiency a Managed KPI with Tech, Automation, and Data
Technology reduces variability and waste while capturing the data you need. Track weekly KPIs to catch problems before they compound into margin losses.
Where Automation Helps Most
Automated and precision feeding systems address the operational factors that drag efficiency down: inconsistent delivery, feed waste, and poor mixing accuracy. These systems deliver the same ration, at the same time, with the same particle distribution while removing human variability from daily feeding.
The bigger win is often waste reduction. Systems that meter feed accurately and track refusals identify when bunks are overfilled or when intake drops before cattle show visible signs of problems.
Practical Measurement Options
Not every operation needs individual animal intake systems. Practical measurement tiers include: Pen-level tracking (total feed delivered minus refusals, divided by head count—works for most commercial feedlots); Group DMI estimates (weighing feed trucks before and after delivery with periodic DM testing); Individual intake systems (GrowSafe, Insentec, or similar technology for research and seedstock operations).
Start with pen-level accuracy before investing in advanced systems. EID integration streamlines individual animal data capture when you’re ready to move beyond pen averages.
KPI Dashboard Template (Weekly + Monthly)
Track these metrics to manage feed efficiency as an operational KPI:
| KPI | How to Measure | Frequency | Red Flag | Likely Causes | First Fix |
| DMI/hd/day | Feed ÷ head ÷ days | Weekly | >5% swing | Bunk, weather | Check delivery |
| ADG | Weight change ÷ days | Weekly | >10% below target | Health, intake | Review records |
| FCR (F:G) | DMI ÷ ADG | Bi-weekly | >6.5 finishing | Ration, instability | Audit ration |
| Refusals % | Refusals ÷ Delivered | Daily | >3% | Overfeeding | Adjust bunk calls |
| Health pulls % | Pulls ÷ Head count | Weekly | >2% weekly | Disease pressure | Vet consult |
Assessing Profitability to Turn Feed Efficiency into Dollars
A 0.5 FCR improvement can mean $40+ per head in feed savings. Convert ratios to cost-per-pound-gain to see what efficiency actually delivers.
Cost per lb Gain + Sensitivity
Here’s where efficiency translates to margin. Assume a finishing ration costs $0.11 per pound of DM:
• At FCR 5.5: Cost per lb gain = $0.61
• At FCR 6.0: Cost per lb gain = $0.66
• At FCR 6.5: Cost per lb gain = $0.72
Over 400 lb of gain, the difference between 5.5 and 6.5 FCR is $44 per head in feed cost alone. Scale that across 1,000 head and you’re looking at $44,000 in margin difference—same cattle, same days on feed, same market weight.
This sensitivity analysis should drive management decisions. A $5,000 investment in improved bunk management that moves FCR from 6.2 to 5.8 across 500 head pays back quickly.
Dairy Profit Lens
In dairy, income over feed cost (IOFC) often provides more actionable insight than ECM/DMI alone. Two cows can show identical feed efficiency but different profitability because one produces more total milk. According to University of Wisconsin research, a cow producing 95.9 lb ECM on 58 lb DMI (1.65 ECM/DMI) generates $9.34 IOFC, while a cow producing 101.6 lb ECM on 61.6 lb DMI (same 1.65 ratio) generates $9.86 IOFC.
The higher-producing cow is more profitable despite identical efficiency because the additional revenue from more milk exceeds the additional feed cost. Financial tracking tools that connect production data to economics help you make these distinctions.
A Practical 30–60–90 Day Feed Efficiency Improvement Plan
Start by fixing measurement, then target ratios and health levers, then build lasting SOPs. Systematic changes compound faster than scattered improvements.
First 30 Days: Measurement Reset
- Before you can improve efficiency, you need to trust your numbers.
- Standardize weighing protocols; same scale, same time relative to feeding, same fill conditions.
- Establish a DM testing cadence.
- A cattle management system that timestamps every weight and feed delivery makes this audit straightforward.
Next 60 Days: Highest-ROI Levers
- With reliable data in hand, target one variable at a time.
- Start with bunk management: consistent delivery times, appropriate bunk calls, and clean bunks.
- Then evaluate the ration delivery accuracy: is the mixer actually delivering what the nutritionist formulated?
- Monitor health events closely and track response lag; changes today may not show up in FCR for 2–3 weeks.
Next 90 Days: Structural Gains
- Once operational basics are solid, consider structural improvements.
- Evaluate genetic selection criteria. Does your bull battery include feed intake or RFI data?
- Assess whether feeding automation or precision systems would deliver ROI at your scale.
- Document standard operating procedures for feeding, weighing, and data entry.
Ready to turn feed efficiency from a report metric into a managed profit driver? Connect with our team to see how Cattlytics can help you track, benchmark, and improve efficiency across your operation.
FAQs
What Is Feed Efficiency in Cattle?
Feed efficiency in cattle measures how effectively animals convert feed into product whether that’s pounds of gain for beef cattle or milk for dairy cows. Higher efficiency means more output per unit of feed input, directly improving profitability by reducing the highest variable cost in cattle production.
What’s the Difference Between Feed Efficiency and Feed Conversion Ratio?
Feed efficiency and feed conversion ratio describe the same relationship from opposite directions. Feed efficiency is output divided by input (higher is better), while FCR is input divided by output (lower is better). A steer with 6:1 FCR has a feed efficiency of 0.167.
What Is a Good Feed Conversion Ratio for Cattle?
For feedlot cattle on finishing rations, FCR typically ranges from 4.5 to 7.5, with values below 6.0 considered good. Backgrounding cattle on forage-based programs generally runs higher, in the 6–10 range. Genetics, ration quality, and health status all influence where cattle fall within these ranges.
How Do I Calculate Feed Efficiency on My Farm Without Fancy Equipment?
Start with pen-level tracking: weigh total feed delivered, subtract refusals, convert to dry matter, and divide by head count and days. Weigh cattle at consistent intervals using the same scale. Calculate FCR as total pounds DM consumed divided by total pounds gained. Multiply FCR by your ration cost per pound DM to get the cost per pound of gain.
What Is Residual Feed Intake and Should I Care?
Residual feed intake (RFI) measures whether an animal eats more or less than expected based on its size and growth rate. Negative RFI indicates efficiency asthe animal gains the same on less feed. RFI matters most for genetic selection decisions; it’s included in many breed association indexes and helps identify inherently efficient genetics to build into your herd over time.