

Buying cattle at the right price is just the first step. Feed, yardage, health, performance, financing, and the final sale value all work together to decide whether a pen of cattle makes money or loses it. A cattle breakeven calculator helps you estimate the sale price your cattle need to reach to cover costs and shows the potential margin per head before you commit.
But the calculation is only as reliable as the inputs behind it. If your numbers do not match real feedlot operations, the projection can steer you toward a bad decision just as easily as a good one.
In this article, you will learn how to calculate cattle breakeven price step by step, run a realistic feedlot example, understand cost of gain, test your assumptions with sensitivity analysis, and compare stocker versus feedlot breakeven.
What Is Cattle Breakeven and Why Does It Matter in a Feedlot?
Every feeding decision comes down to one number. If you do not know your breakeven, you are guessing at profitability.
What Does Cattle Breakeven Mean?
Cattle breakeven is the sale price at which total revenue equals the total cost of purchasing, feeding, managing, financing, and marketing the animal. At breakeven, you have recovered every included cost but generated no additional profit.
The result can be expressed as:
- Cost per head (total dollars spent on one animal)
- Price per pound (breakeven on a live-weight basis)
- Price per cwt (breakeven per hundred pounds, the most common industry format)
Breakeven Cost Versus Profit per Head
These terms are related but not interchangeable:
| Term | What It Means |
| Total cost per head | Every dollar spent on one animal from purchase through sale |
| Breakeven sale price | The minimum price needed to recover total cost |
| Expected selling price | The price the market is expected to pay at sale time |
| Revenue per head | Total dollars received when the animal sells |
| Profit or loss per head | Revenue per head minus total cost per head |
When expected selling price is above breakeven, the pen projects a profit. When it is below, you are looking at a loss.
How Do Feedlots Calculate Breakeven Cost per Head?
Breakeven is a five-step process. Each step builds on the one before it, and skipping any input weakens the entire projection.
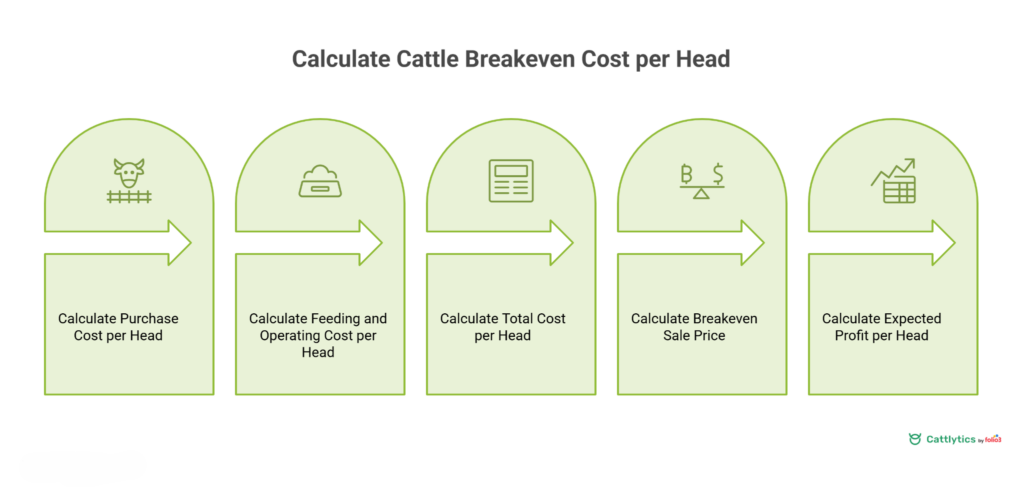
Step 1: Calculate Purchase Cost per Head
Start with what you paid to get cattle to the yard.
Inputs:
- Purchase weight (lbs)
- Purchase price per cwt
- Freight or delivery cost
- Buying commissions
- Receiving costs (where applicable)
Purchase cost per head = (purchase weight ÷ 100) × price per cwt + freight + commissions + receiving costs
Step 2: Calculate Feeding and Operating Cost per Head
This is where most of the money goes. Include every cost that touches the animal between arrival and sale.
- Feed (ration cost × pounds consumed)
- Yardage
- Processing (arrival protocols)
- Veterinary treatments
- Medicine
- Mortality allowance (cost spread across surviving head)
- Interest on cattle and feed investment
- Outbound freight
- Marketing and selling expenses
- Price protection (hedging or insurance costs)
- Other operating expenses
A good feed efficiency program directly reduces this number.
Step 3: Calculate Total Cost per Head
Total cost per head = cattle purchase cost + feeding cost + yardage + health cost + financing + other operating and marketing costs
This is the number your sale revenue must beat.
Step 4: Calculate Breakeven Sale Price
Breakeven price per pound = total cost per head ÷ expected pay weight (lbs)
To convert to price per cwt, multiply by 100.
Breakeven price per cwt = breakeven price per pound × 100
Most industry reports and calculators display breakeven per cwt because that is how fed cattle are priced in the cash market.
Step 5: Calculate Expected Profit per Head
Profit per head = expected sale revenue per head minus total cost per head
- Positive result: the pen is projected to make money.
- Zero result: you are at breakeven.
- Negative result: the pen is projected to lose money at that sale price.
What Inputs Does a Cattle Breakeven Calculator Need?
A calculator is only as good as the data you put into it. Missing or outdated inputs create false confidence in the projection.
Cattle Purchase and Weight Inputs
- Purchase price per cwt
- Number of head
- In weight (arrival weight)
- Shrink assumptions (percent lost during transport)
- Expected finished weight
- Expected sale weight (after pencil shrink at sale)
Feeding and Performance Inputs
- Ration cost (per ton or per head per day)
- Dry matter intake
- Feed conversion ratio (lbs of feed per lb of gain)
- Average daily gain (ADG)
- Days on feed
- Pounds gained
Operating and Financial Inputs
- Yardage (daily pen charge per head)
- Processing costs
- Veterinary and medicine costs
- Death loss percentage
- Labor and facility expenses (where appropriate)
- Financing (interest on cattle and feed)
- Freight (inbound and outbound)
- Marketing and selling costs
Market Inputs
- Expected fed cattle price
- Futures price (where appropriate)
- Basis (local cash price minus futures)
- Expected sale date
- Marketing method (live, grid, formula, negotiated)
- Pay weight assumptions (pencil shrink at sale)
Input Checklist
| Input | Unit | Where It Comes From | Why It Changes Breakeven |
| Purchase price | $/cwt | Auction, video sale, direct | Higher price raises total cost |
| Feed cost | $/ton or $/hd/day | Mill invoice, ration formulation | Largest variable cost category |
| ADG | lbs/day | Scale weights, closeout data | Lower ADG extends days on feed |
| Feed conversion | lbs feed/lb gain | Closeout records | Poorer conversion raises feed cost |
| Yardage | $/hd/day | Feedlot cost structure | Adds up fast over 150+ days |
| Death loss | % | Yard records | Spreads cost across fewer head |
| Sale price | $/cwt | Futures, cash bids, basis | Determines whether you profit or lose |
Cattle Breakeven Calculator Example: From Purchase to Profit per Head
Numbers make more sense than theory. Here is how one pen of cattle moves from purchase through closeout.
Example Feedlot Scenario
These numbers are hypothetical and do not represent current market recommendations.
- Head: 100 steers
- Purchase weight: 750 lbs
- Purchase price: $260/cwt
- Days on feed: 160
- Expected ADG: 3.5 lbs
- Finished weight: 1,310 lbs
- Feed cost: $5.50/hd/day
- Yardage: $0.55/hd/day
- Processing and treatment: $45/hd
- Death loss assumption: 1.5%
- Interest (cattle + feed): $55/hd
- Projected sale price: $195/cwt
Calculate Cost per Head
| Cost Component | Amount per Head |
| Purchase cost | $1,950 |
| Feed (160 days × $5.50) | $880 |
| Yardage (160 days × $0.55) | $88 |
| Processing and treatment | $45 |
| Death loss allowance (1.5%) | $29 |
| Interest | $55 |
| Outbound freight and marketing | $30 |
| Total projected cost per head | $3,077 |
Calculate Breakeven Price per Pound and per Cwt
Expected pay weight (after 4% pencil shrink): 1,310 × 0.96 = 1,257.6 lbs
- Breakeven per pound: $3,077.25 ÷ 1,257.6 = $2.447/lb
- Breakeven per cwt: $2.447 × 100 = $244.70/cwt
Both units represent the same breakeven. Use whichever matches how your buyer quotes the price.
Calculate Profit or Loss per Head
Expected sale revenue per head: 1,257.6 lbs × $1.95/lb = $2,452.32
| Scenario | Sale Price ($/cwt) | Revenue/Head | Cost/Head | Profit or Loss/Head |
| Breakeven | $245 | $3,077.25 | $3,077.25 | $0.00 |
| Profitable | $260 | $3,269.76 | $3,077.25 | +$192.51 |
| Loss | $230 | $2,892.48 | $3,077.25 | -$184.77 |
Scale the Result From One Head to the Pen
A $10/cwt move on 100 head at 1,257.6 lbs pay weight changes the pen result by roughly $12,576. What looks like a small per-head swing becomes a major financial event across hundreds or thousands of cattle. That is why breakeven accuracy matters before cattle ever enter the yard.
How Cost of Gain Changes Cattle Breakeven
Cost of gain is one of the biggest levers in feedlot profitability. Understanding it is not optional.
How Do You Calculate Cattle Cost of Gain?
Cost of gain = costs associated with producing additional weight ÷ pounds gained
Two versions exist:
- Feed-only cost of gain: includes only ration cost divided by pounds gained
- Total cost of gain: includes feed, yardage, health, processing, interest, and all other costs divided by pounds gained
The distinction matters because feed-only metrics can significantly understate the real cost of finishing cattle. When you compare lots or evaluate whether to retain ownership, total cost of gain gives you the complete picture.
What Drives Cost of Gain Higher?
- Higher ration costs (corn, hay, supplements)
- Poorer feed conversion
- Lower ADG
- Longer days on feed
- Health problems requiring treatment
- Weather and mud (reduced intake, increased maintenance energy)
- Mortality (cost spread across fewer surviving head)
- Increased yardage on longer feeding periods
Research found that each $0.10 per bushel increase in corn price raises feeding cost of gain by approximately $0.99 per cwt, and each 0.10 increase in feed conversion raises it by roughly $2.08 per cwt.
Cost of Gain Versus Value of Gain
Putting on weight does not automatically create profit. Understanding how cattle gain weight and what drives finishing performance helps you set realistic ADG and cost assumptions before placement. If the cost of adding a pound exceeds what the market pays for that pound, every day on feed moves you further from profitability.
Utah State University’s breakeven calculator guidance specifically distinguishes total cost of gain from value of gain. If cost of gain exceeds value of gain, the feeding scenario is not profitable regardless of the projected sale price.
How Feed Cost, Yardage, Performance, and Death Loss Move Breakeven
A breakeven number is built on assumptions. Before you buy cattle, you need to know which assumptions can break you.
Run a Sensitivity Analysis Before Making the Decision
A sensitivity analysis tests what happens to your breakeven and profit when individual inputs change.
| Variable | Base Assumption | Changed Assumption | New Breakeven ($/cwt) | Change in Profit/Head |
| Feed cost | $5.50/hd/day | $6.50/hd/day | $257.40 | -$160.00 |
| ADG | 3.5 lbs | 3.0 lbs | $254.80 | -$127.00 |
| Feed conversion | $6 | $6.50 | $252.10 | -$93.00 |
| Yardage | $0.55/hd/day | $0.75/hd/day | $247.25 | -$32.00 |
| Death loss | 1.50% | 3.00% | $248.40 | -$46.50 |
| Purchase price | $260/cwt | $270/cwt | $250.66 | -$75.00 |
| Sale price | $195/cwt | $185/cwt | $244.70 | -$125.76 |
Figures are directional estimates based on the example scenario. Your results will differ.
Which Inputs Deserve the Most Attention?
No single variable always dominates. The answer depends on your operation, your cost structure, and the current market. But you should continuously test these against your breakeven:
- Purchase price and sale price (biggest absolute dollar impact)
- Cost of gain (feed cost, feed conversion, ADG combined)
- Death loss (especially above 2%)
- Days on feed (drives yardage, interest, and total feed consumed)
How Is Stocker Cattle Breakeven Different From Feedlot Breakeven?
Feedlot finishing and stocker operations both calculate breakeven, but the cost structures and performance drivers are different.
Stocker and Backgrounding Breakeven
Backgrounding breakeven places greater emphasis on:
- Purchase price relative to expected sale price
- Grazing or forage costs (pasture rent, hay, crop residue)
- Supplementation
- Health costs during the receiving period
- ADG on forage-based programs
- Days owned
- Sale weight and the price-weight slide
- Value of gain versus cost of gain
Finishing Cattle Breakeven
Finishing breakeven places greater emphasis on:
- Feed conversion and ration cost
- Yardage
- Health costs during the finishing period
- Finished weight and dressing percentage
- Fed cattle sale price
- Carcass or live marketing arrangements (grid premiums and discounts)
Comparison Table
| Metric | Stocker/Backgrounding | Feedlot Finishing |
| Primary cost driver | Purchase price and grazing cost | Feed and yardage |
| Key performance measure | Value of gain vs. cost of gain | Feed conversion and ADG |
| Market endpoint | Feeder cattle market | Fed cattle market |
| Major risk | Price-weight slide, weather | Feed cost, overfeeding, health |
Estimated Breakeven Versus Actual Feedlot Profit
A calculator tells you what should happen. Your records tell you what actually happened. Those two numbers rarely match.
Why Projected Breakeven Changes After Cattle Enter the Yard
Every assumption you entered before placement can shift once cattle are on feed:
- Feed consumed may exceed or fall short of projections
- Ration costs change with commodity markets
- Weight gain and finishing performance can vary from projected ADG
- Days on feed extend if cattle do not finish on schedule
- Treatment costs increase with pulls and retreats
- Mortality reduces the number of head available to sell
- Yardage accumulates with extra days
- Sale weight and sale price change with the market
Compare Your Projection With the Closeout
The only way to know whether your breakeven projections were useful is to compare them against actual closeout results.
Framework:
Projected breakeven → Actual operating records → Pen closeout → Actual cost per head → Actual margin per head
This kind of data demonstrates why producers should measure against actual results rather than relying only on pre-placement forecasts. If you are not tracking your actuals against your projections, you are flying blind on the next pen.
Common Cattle Breakeven Calculation Mistakes
Small errors in your inputs create big errors in your projection. Here are seven mistakes that show up repeatedly.
Avoid These Seven Mistakes
- Using outdated cattle prices. Feeder and fed cattle markets move weekly. A breakeven based on last month’s prices can be off by $10/cwt or more.
- Underestimating feed cost. Ration ingredients change price. If you lock in an old corn price, your projected feed cost will miss reality.
- Ignoring yardage. Yardage at $0.50 to $0.75/hd/day over 160 days adds $80 to $120 per head. Leaving it out distorts the entire calculation.
- Treating feed cost of gain as total cost of gain. Feed-only cost of gain excludes yardage, health, interest, and marketing. Using it as your total cost of gain will make your breakeven look better than it actually is.
- Ignoring health costs and death loss. Cattle that require treatment cost more. Cattle that die spread their purchase and feeding costs across fewer survivors.
- Using unrealistic ADG or feed conversion assumptions. Projecting 4.0 lbs ADG when your yard historically runs 3.4 lbs will underestimate days on feed and total cost.
- Calculating breakeven once and never updating it. Markets, performance, and costs change throughout the feeding period. A breakeven that is never revisited becomes a guess.
From Calculator Estimates to Actual Feedlot Profitability
A calculator gives you a starting point. Sustained profitability requires tracking what happens after placement.
Why a Calculator Alone Is Not Enough
A calculator answers: What should happen if these assumptions are correct?
Your feedlot records answer: What is actually happening?
The gap between those two questions is where money is made or lost. Every pen teaches you something, but only if you capture and compare the data.
Track the Numbers Behind Your Breakeven With Cattlytics
Cattlytics Feedlot connects purchasing, cattle lots, feeding, health, inventory, weights, closeouts, and financial reporting in one platform. It also supports feed usage tracking, treatment cost recording, cost of production analysis, and lot profitability reporting.
That means the inputs behind your breakeven are captured where you can actually compare projections to results:
- Purchase cost and lot creation
- Feed consumption and ration tracking
- Weight performance and ADG
- Health treatments and costs
- Cattle inventory and movements
- Closeouts and lot-level profitability
Book your consultation with experts to discover how Cattlytics helps feedlots track cost per head, cost of gain, and cattle profitability.
Conclusion
A cattle breakeven calculator gives you the number your cattle need to hit to cover costs. It helps you project profit or loss per head before you buy, and it shows which variables carry the most financial weight.
But breakeven is only a forecast. Profitability depends on how closely your actual feed costs, weight performance, health results, and sale prices match what you projected. The feedlots that consistently make money are the ones that track actuals against projections on every pen.
If you are ready to move beyond spreadsheets and start capturing the data behind your breakeven in one connected system, book your consultation to discuss what Cattlytics Feedlot can do for your operation.
FAQs
How Often Should You Update a Cattle Breakeven Calculation?
Update your breakeven every time a major input changes. Feed prices, cattle futures, and performance data shift throughout the feeding period. Re-running the calculation monthly or after a significant market move keeps your projection grounded in current reality.
Can You Use a Cattle Breakeven Calculator for Heifers?
Yes. The same formula applies to heifers. However, heifers typically have slightly different feed conversion, ADG, and finished weights than steers. Adjust your inputs to reflect heifer-specific performance, or your projections will overestimate returns.
What Is a Good Cost of Gain for Feedlot Cattle?
It depends on current feed markets and your operation’s efficiency. Feeding cost of gain has ranged widely based on corn and hay prices. Any cost of gain below the value of gain is a viable feeding scenario.
Does Purchase Price or Sale Price Affect Breakeven More?
Both carry significant weight, but they affect breakeven differently. Purchase price sets your cost floor before you spend a dollar on feed. Sale price determines whether that cost floor gets recovered. In most feeding scenarios, a $10/cwt change in either one creates a meaningful shift in profit per head.
How Do You Account for Death Loss in a Breakeven Calculation
Spread the cost of dead animals across the surviving head. If you start with 100 head and lose 2, the purchase and feeding costs of those 2 head get divided among the remaining 98. This raises your effective cost per head and pushes breakeven higher.
What Role Does Basis Play in Cattle Breakeven?
Basis is the difference between your local cash price and the futures contract price. A strong basis (cash price closer to or above futures) works in your favor. A weak basis means the cash price you actually receive may fall short of what futures implied, shifting your breakeven result into loss territory.
Is Breakeven Analysis Different for Retained Ownership Cattle?
Yes. Retained ownership breakeven starts with the market value of the calf at the point the producer chose to retain instead of sell. That opportunity cost replaces the purchase price. The rest of the cost structure (feed, yardage, health, interest) is built on top of that starting value, and the comparison is made against the expected sale price at the end of the retention period.