

Feedlot health affects much more than your treatment bill. Every disease event that goes unmanaged leaves a mark on feed intake, average daily gain, feed conversion, days on feed, labor, and the final number on your closeout sheet.
Poor health and poor performance are the same problem. One just shows up earlier.
Better feedlot health management means detecting problems sooner, treating consistently, tracking what happens after treatment, and connecting health records to production and financial data. When you can see all of that together, the real cost of poor cattle health stops being invisible.
Why Is Feedlot Health Important for Profitability?
Poor health raises costs while reducing gain and extending days on feed. Both hit closeout return, often more than managers expect when they look only at the treatment bill.
Feedlot health is directly tied to profitability because disease reduces feed intake and daily gain while adding treatment costs, labor, hospital pen resources, and extra days on feed. When health events compound across a lot, the damage extends well beyond the cost of medication.
How Does Feedlot Animal Health Affect Performance?
Disease changes how cattle perform, and those effects often carry through to closeout, not just while the animal is visibly sick.
Common performance impacts of a health event include:
- Reduced feed intake during and after illness
- Lower average daily gain (ADG) across the feeding period
- Slower feed conversion, meaning more feed per pound of gain
- Longer days on feed, adding cost without proportional weight gain
- Reduced carcass performance at harvest
Research confirms the performance gap is real and grows with each additional treatment. In one controlled finishing study, calves treated 3-4 times for BRD had starting weights 64 kg lower than never-treated cattle at the beginning of finishing. That difference follows the animal all the way to the closeout sheet.
Where Does Poor Health Increase Feedlot Costs?
Treatment costs are the most visible line item. The losses that follow are harder to see but often larger in total.
Here is how the cost chain builds from one health event:
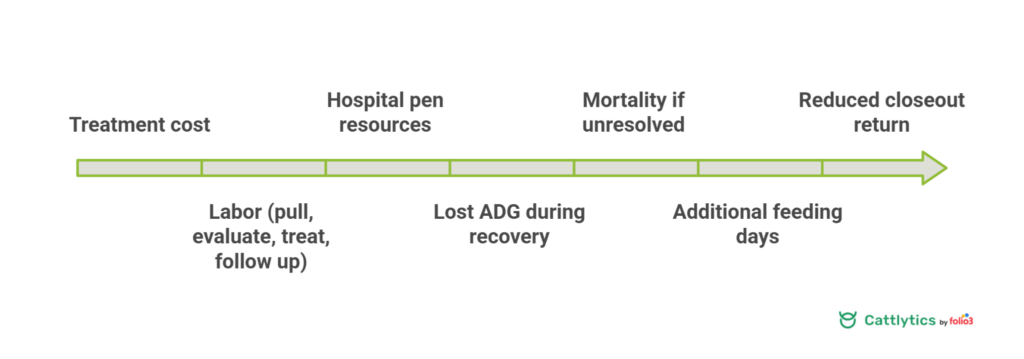
Medication is the smallest piece. The real cost is slower gain, more days on feed, and lower performance at closeout. Across a full lot, those losses compound faster than most managers realize when they track only what was spent on drugs.
What Are the Common Health Problems in Feedlot Cattle?
Knowing which conditions drive the most morbidity helps you focus observation resources where they matter. These are the health risks that affect feedlot cattle most consistently.
Bovine Respiratory Disease and Respiratory Pulls
BRD deserves more attention than any other health category in the feedlot.
Data show BRD accounts for 70-80% of feedlot morbidity and 40-50% of feedlot deaths, making it the single largest driver of health-related loss in lot-fed operations. In a 2011 national feedlot survey, 16.2% of all cattle placed on feed were treated for BRD.
Factors that raise BRD risk include:
- Shipping stress, which suppresses immune function in the first days after arrival.
- Commingling, which exposes cattle to unfamiliar pathogens from multiple sources.
- Incomplete or unknown vaccination history.
- Cattle naive to feedlot conditions and transition rations.
The distinction between a first treatment and a third matters. First-treatment success is manageable. Repeat treatments signal relapse or chronic progression, and those animals consistently produce the worst closeout results. Chronic cattle represent the furthest end of that spectrum.
An effective beef cattle vaccination protocol at receiving is one of the most cost-effective ways to reduce respiratory morbidity in the first 45 days on feed.
Lameness, Digestive Disorders, and Heat Stress
BRD gets the most attention, but other conditions also reduce performance and welfare throughout the feeding period.
- Footrot and lameness in cattle limit movement and bunk access, cutting intake and ADG.
- Acidosis follows rapid ration changes, particularly during the transition period at receiving.
- Bloat can be acute or frothy and requires fast intervention.
- Heat stress suppresses feed intake during summer finishing and directly reduces ADG in affected pens.
Each condition works through a different mechanism, but the outcome is the same: reduced gain and a higher per-head cost.
What Makes Cattle Higher Risk?
Not all placements carry the same health risk. Classifying cattle at receiving helps you allocate pen rider attention where it is needed most.
| Risk Factor | Lower Risk | Higher Risk |
| Source | Direct cow-calf | Sale barn |
| Weaning status | Weaned 45+ days | Fresh-weaned |
| Transport | Short haul, single load | Long haul, multiple stops |
| Commingling | Single source | Multiple sources |
| Vaccination | Documented history | Unknown or incomplete |
| Arrival condition | Good body condition | Thin or stressed |
| Bunk experience | Prior grain exposure | Grass only |
Recognizing signs of stress in cattle early at receiving helps your team flag animals that need closer observation in the first weeks on feed.
What Are Feedlot Cattle Health Management Best Practices From Receiving to Closeout?
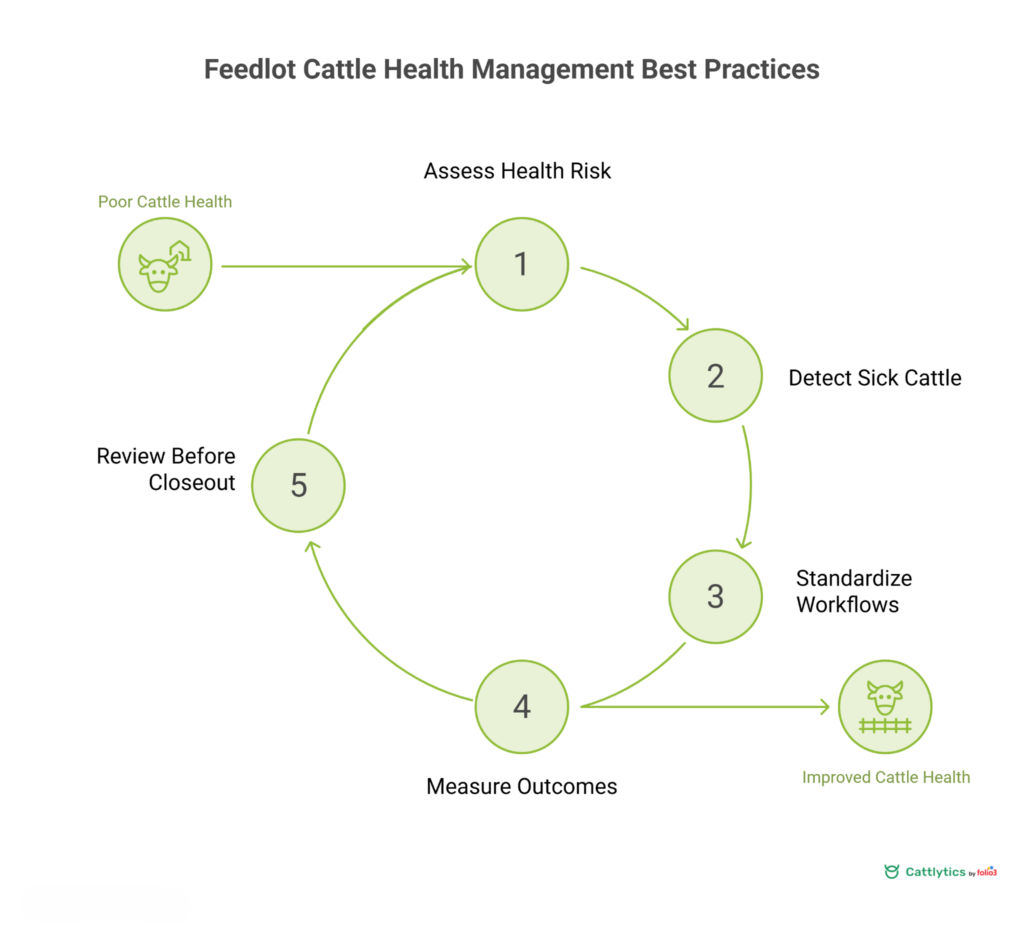
Feedlot cattle health management works best when it follows a consistent process at every stage. Treatment protocols are part of that, but not the whole thing.
1. Assess Health Risk at Receiving
The information you collect at receiving shapes every health decision that follows. For each animal or lot, document:
- Source and geographic origin
- Transport distance and duration
- Degree of commingling in transit or at the sale barn
- Prior health history, if available
- Vaccination records and timing
- Arrival body condition and weight
- Individual identification (visual tag or EID)
- Existing treatments and active withdrawal periods
- Risk classification for the lot
Cattle arriving from sale barns often carry less documented health history than cattle sourced directly from cow-calf or backgrounding operations. That gap in known history is a risk factor worth recording at intake.
Preconditioning of calves before feedlot entry can substantially reduce morbidity during the receiving period. When sourcing cattle, documented preconditioning is a strong signal of lower expected health cost.
2. Detect Sick Cattle Earlier
Earlier detection means earlier treatment, lower relapse rates, and better performance recovery. Your pen riders are the primary detection tool you have.
Use a consistent observation framework:
Observe → Identify → Pull → Evaluate
Train pen riders to flag:
- Behavioral changes, isolation, or depression
- Reduced interest at the bunk or standing apart from the group
- Respiratory signs, including nasal discharge, coughing, or labored breathing
- Abnormal movement or gait
- Visible lameness
- Heat stress indicators during warm-weather feeding periods
Observation criteria need to stay consistent across riders. One rider pulling at first signs while another waits for obvious illness creates uneven treatment timing, which affects outcomes and the reliability of your health records.
3. Standardize Treatment and Hospital Pen Workflows
Every treatment event should follow a defined process so records stay complete and nothing falls through the gap between the pull and the follow-up.
Pull → Diagnose → Treat → Record → Schedule Follow-Up
Each treatment record should capture:
- Animal ID or EID number
- Reason for pull or diagnosis
- Medication product used
- Date of treatment
- Dose administered
- Route of administration
- Withdrawal period and clearance date
- Treatment number (first, second, third)
- Hospital pen assignment and movement
- Name of person performing treatment
All treatment decisions should stay within your veterinarian-approved protocol. A consistent workflow makes training straightforward and keeps documentation complete across your entire team.
4. Measure Recovery, Relapse, and Treatment Failure
Recording a treatment is not the end of the health event. What happens after treatment determines whether the animal recovers or becomes chronic.
After each treatment, track:
- Scheduled follow-up date
- Clinical response at follow-up
- Date and condition at return to home pen
- Retreatments and reason for each
- Relapse classification
- Chronic designation if applicable
- Mortality outcome and cause
Without this follow-up data, your first-treatment success rate is incomplete, and that metric is one of the most informative ones a feedlot manager has.
5. Review Health Before Closeout
Before closing a lot, run a health summary alongside the production numbers. Review total pulls, morbidity rate, retreatments, relapse rate, treatment cost per head, and death loss. Then look at those figures beside ADG, feed conversion, days on feed, and cost of gain. Connecting health events to production results at closeout tells you more than either data set does on its own.
What Health Records Should Feedlots Keep for Each Animal?
Complete health records support treatment decisions, protect against liability, and make lot-level analysis possible. Both individual records and aggregate pen data have a role.
Individual Animal Health Records
Every health event should produce a complete record at the animal level. Beef Quality Assurance (BQA) guidance is explicit about what information should accompany each treatment record, and those requirements align closely with what managers need to track outcomes over time.
Feedlot Animal Health Record Checklist:
- Animal ID or EID number
- Pen and lot assignment
- Date of health event
- Symptoms or diagnosis
- Treatment product and lot information
- Dose administered
- Route of administration
- Treatment number (first, second, chronic)
- Vaccination history
- Withdrawal period and clearance date
- Follow-up date
- Recovery status
- Name of person responsible
For a deeper look at how individual identification connects to treatment records, see methods of livestock identification and how they integrate with health data at the animal level.
Pen and Lot Level Health Records
Individual records alone are not enough. You need to be able to aggregate data at the pen and lot level to see patterns and compare placements.
At the pen and lot level, track:
- Total number of pulls by time period
- Morbidity rate (percentage of lot treated)
- Treatments by disease category
- Relapse and retreatment rates
- Death loss with cause
- Health cost per head
- Days from arrival to first pull
- Distribution of health events across the feeding period
Lot-level health data is what lets you compare placements, identify problem sources, and make better buying decisions for the next round.
What KPIs Should Feedlots Track for Animal Health and Performance?
The right numbers turn health management from reactive to proactive. Tracking them consistently helps you act before small problems turn into expensive ones.
Health KPIs
| Metric | What It Measures | Why It Matters | Level |
| Pull rate | Animals pulled per observation period | Pen rider effectiveness and early detection | Pen |
| Morbidity rate | % of lot treated for any illness | Overall lot health status | Lot |
| Respiratory morbidity | % treated specifically for BRD | BRD exposure and protocol effectiveness | Lot |
| Mortality rate | % of lot that died | Severity of health outcomes | Lot |
| Death loss | Total deaths with cause | Disease category breakdown | Lot |
| First treatment success | % recovered after first treatment | Treatment protocol effectiveness | Lot |
| Repeat treatment rate | % requiring two or more treatments | Severity and relapse tracking | Lot |
| Relapse rate | Returns to hospital after release | Post-treatment monitoring | Individual/Lot |
| Chronic rate | % classified as chronic | Long-term health problem identification | Lot |
| Recovery rate | % returned to home pen healthy | Program outcome | Lot |
| Treatment cost per head | Average treatment spend per head | Cost efficiency | Operation |
| Health cost per head | Total health-related cost per head | Full financial impact | Lot |
Tracking these KPIs consistently across lots gives you the benchmarks to compare placements and a way to quantify what improved health management is actually worth at closeout.
Connect Health KPIs With Production and Financial KPIs
Health numbers tell you how many cattle got sick. They do not tell you what that cost the operation. For that, you need health data sitting beside production and financial performance.
Track alongside your health KPIs:
- Average daily gain (ADG)
- Feed conversion ratio
- Feed efficiency
- Total weight gain
- Days on feed
- Feed cost per head
- Cost of gain
- Total treatment cost
- Profit per head
A morbidity rate by itself does not answer the useful question. The useful question is: what happened to performance and cost of gain when health outcomes changed?
Our guides on feed conversion ratio for cattle and feed efficiency in cattle production explain how these production metrics connect directly to the health decisions you make at the pen level.
How Can Technology Improve Feedlot Cattle Health Management?
The right tools reduce the gap between data collection and the decisions that depend on it. Here is what better systems actually change on the ground.
Capture Health Events Where the Work Happens
Health data is most useful when it is captured at the point of care. If pen riders and treatment crews are recording on paper or relying on memory, data arrives late, incomplete, and inconsistent.
A well-structured data flow looks like this:
Pen rider → Animal ID scan → Pull → Chute-side entry → Hospital pen assignment → Scheduled follow-up → Recovery or re-treat
Tools that make this work in the field include:
- Mobile entry at the chute or in the pen
- Offline data capture for areas with limited connectivity
- EID and RFID integration for fast, accurate animal identification
- Access to full treatment history at the chute
- Automated follow-up alerts and vaccination reminders
Learn more about how EID tags support cattle traceability and why accurate identification is the starting point for reliable health records.
Move Beyond Disconnected Spreadsheets
Paper logs and separate spreadsheets create real limitations. Most feedlot managers recognize these problems but have not fully solved them.
Common issues include:
- Delayed data entry and updates
- Duplicate records or conflicting animal information
- No treatment history visible at the chute
- Inconsistent animal identification across records
- Missed follow-ups and withdrawal clearance dates
- Health costs separated from production and financial data
- Pen and lot analysis requiring significant manual effort
These are not minor inconveniences. They are the reason common herd health management mistakes happen repeatedly on operations that otherwise run well.
For feedlots trying to connect these workflows, Cattlytics cattle management software brings animal health, treatment history, pen records, feeding, inventory, and financial data into the same operational record.
How Can Feedlot Health Data Improve Closeout Decisions?
Connecting health records to closeout performance is where feedlot health management moves from operational to strategic. Most operations skip this connection entirely.
Compare Health Outcomes With Lot Performance
At closeout, line up health and production data side by side:
| Health Metric | Production Metric |
| Morbidity rate | Average daily gain (ADG) |
| Mortality rate | Feed conversion ratio |
| Repeat treatment rate | Days on feed |
| Treatment cost per head | Cost of gain |
| Relapse rate | Profit per head |
Looking at these together tells you which lot characteristics, cattle sources, or seasons consistently drive better or worse outcomes. That is information you can act on directly. See how a complete feedlot operations review brings health, performance, and financial data together in a single lot analysis.
Turn Closeouts Into Better Receiving Decisions
Historical health data should directly influence how you plan future placements.
Use closeout health results to guide:
- Source evaluation and preferred supplier decisions
- Risk classification for incoming cattle types
- Receiving protocol adjustments based on past outcomes
- Staffing and pen rider attention during high-risk periods
- Purchasing decisions for specific cattle types
- Expected health cost budgeting for future lots
This closes the loop: Receiving → Health Management → Performance → Closeout → Better Next Placement
Every lot you close adds data to that system. Over time, that data compresses health costs and sharpens placement decisions.
Conclusion
Feedlot health data becomes valuable when your team can actually use it: catching problems sooner, following treatment outcomes, comparing pens and lots, and understanding the financial result at closeout.
That takes more than a paper log or a separate spreadsheet per pen. It takes a system that connects health, production, and financial records from cattle arrival through closeout.
Cattlytics livestock management software is built to do exactly that.
See How Cattlytics Helps Manage Feedlot Health and Performance
FAQs
What Is the Biggest Health Risk in Feedlot Cattle?
Bovine respiratory disease (BRD) is the single largest health challenge in feedlot cattle, accounting for 70-80% of feedlot morbidity and 40-50% of deaths. Shipping stress, commingling, and incomplete vaccination history all raise risk, making receiving protocols the first line of defense.
How Can I Reduce Treatment Costs in a Feedlot?
Earlier detection is the most effective way to reduce treatment costs. Cattle caught at first signs of illness respond better to treatment, require fewer retreatments, and return to full performance faster. Consistent pen rider observation and clear pull criteria are the foundation of cost-effective health management.
What Records Should a Feedlot Keep for Each Treatment?
Each treatment record should include animal ID, date, diagnosis, medication product, dose, route, withdrawal period, treatment number, and the name of the person treating. BQA guidance provides a clear, industry-standard checklist for what should be documented at every treatment event.
How Does BRD Affect Feedlot Performance and Profitability?
Cattle treated for BRD show reduced ADG, poorer feed conversion, and often lower carcass performance compared to cattle that were never pulled. Repeat-treated and chronic cattle show even greater performance deficits. These losses accumulate across the entire feeding period and directly reduce closeout return.
What Is a Normal Morbidity Rate for Feedlot Cattle?
Morbidity rates vary by cattle type, source, and season. High-risk sale barn placements can exceed 30%, while preconditioned cattle sourced directly from cow-calf operations may be under 10%. What matters most is tracking morbidity consistently so you can connect it to performance and cost data across lots over time.
When Should a Feedlot Classify an Animal as Chronic?
Most feedlots classify an animal as chronic after three or more treatment failures without sustained recovery, or when the animal continues to lose condition despite protocol treatment. Identifying chronics promptly lets you make early marketing or culling decisions before further losses accumulate.