
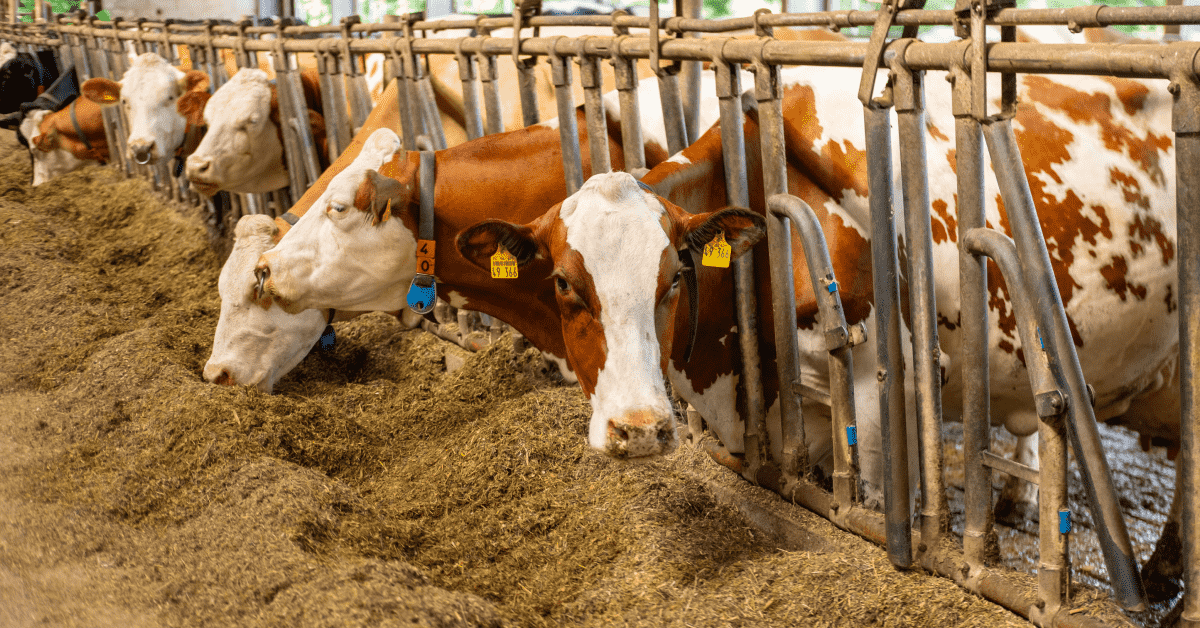

Feed conversion ratio for cattle is the number of pounds of dry matter feed an animal must consume to gain one pound of live body weight. It is the most direct measure of how efficiently your cattle are turning feed into gain. In a feedlot where feed accounts for 60 to 70% of total production costs, feed conversion ratio for cattle is also the most direct measure of how efficiently that cost is being used.
The formula is:
FCR = Total Dry Matter Consumed (lbs) / Total Weight Gained (lbs)
A steer that consumed 1,170 lbs of dry matter over a 150-day period and gained 180 lbs has an FCR of 6.5. A steer that consumed 1,350 lbs of dry matter over the same period and gained 180 lbs has an FCR of 7.5. Both gained the same weight. The difference is roughly $35 to $55 per head in feed cost at typical finishing ration prices. Compounded across 500 head, that is the difference between a profitable closeout and a break-even one.
What Is Feed Conversion Ratio for Cattle?
Feed conversion ratio for cattle measures the relationship between feed input and weight output. Lower is better. An FCR of 5.5:1 means 5.5 lbs of dry matter produced one pound of gain. An FCR of 8.0:1 means 8.0 lbs of dry matter were needed for the same outcome.
In North American feedlot operations, feed conversion ratio for cattle is expressed as feed:gain. In some international markets, it is expressed as gain:feed (the inverse), where a higher number is better. This article uses the North American convention.
For a broader look at the relationship between feed inputs and animal performance, our guide on feed efficiency in cattle covers the key concepts and how they connect.
How to Calculate Feed Conversion Ratio for Cattle: Step-by-Step
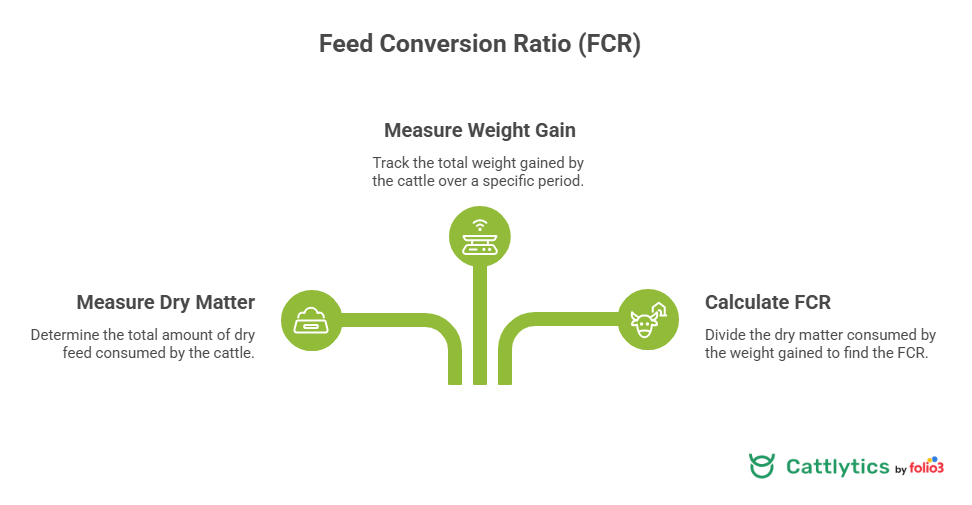
Step 1: Measure total dry matter consumed Record total as-fed ration delivered to the pen across the feeding period. Multiply by the ration’s dry matter percentage.
Example: 100 head fed an average of 26 lbs of as-fed ration per day at 75% DM over 150 days: 100 × 26 × 0.75 × 150 = 292,500 lbs DM consumed
Step 2: Measure total weight gained Total pen gain = (average closeout weight minus average placement weight) × head count.
Example: placed at 750 lbs average, closed at 1,200 lbs average, 100 head: 100 × (1,200 – 750) = 45,000 lbs total gain
Step 3: Calculate FCR FCR = 292,500 / 45,000 = 6.5:1
One important note: feed conversion ratio for cattle must be calculated on a dry matter basis when comparing pens or rations. A silage-heavy ration and a corn-heavy ration have very different as-fed weights at the same DM level. As-fed comparisons mislead. DM-basis comparisons are accurate.
Average Feed Conversion Ratio for Beef Cattle: Phase-by-Phase Benchmarks
Feed conversion ratio for cattle changes across production phases because the feed type, animal physiology, and management goals differ at each stage.
Receiving phase (days 1 to 21 or 28): FCR in the receiving pen typically runs 8.0 to 10.0:1 or worse. Stressed animals suppress feed intake, immune activity draws on energy that would otherwise support growth, and receiving rations are high in roughage. This is expected. High FCR in the receiving pen does not mean the pen is failing. It means the animals are mounting an immune response. The goal in this phase is health, not efficiency.
Growing and stocker phase: On forage-based growing programs, feed conversion ratio for cattle typically ranges from 7.0 to 9.0:1, depending on forage quality and breed. Our stocker cattle guide covers the management factors that shape FCR during this transitional phase. For cattle on backgrounding programs using corn silage or mixed rations, FCR usually falls between 6.0 and 8.0:1. Our guide on backgrounding cattle covers how management in this phase sets up or undermines finishing performance.
Finishing phase: This is where feed conversion ratio for cattle is tracked most closely. According to Oklahoma State University Extension, the average feed conversion ratio beef cattle experience on high-grain finishing rations runs 6.0 to 6.5:1 in commercial feedlots. Top-performing pens reach 5.5:1 or better. Underperforming pens commonly run 7.5:1 or higher, often with identifiable causes.
The spread between a 5.5:1 pen and a 7.5:1 pen can exist within the same feedlot, on the same ration, in the same season. What separates them is placement quality, health events, bunk management, and genetics.
What Drives Feed Conversion Ratio for Beef Cattle?
Health Status
A sick steer diverts energy and protein away from muscle and fat deposition toward immune response. An animal treated for bovine respiratory disease (BRD) in the first 30 days will often convert at 8.0:1 or worse during the illness period, even if it responds to the first treatment. Animals that require multiple retreatments, or become chronic, can pull a pen’s overall FCR high enough to erase the closeout margin.
Protecting feed conversion ratio for cattle starts with the receiving protocol and early pull decisions, not with the ration. Fast identification and treatment of fresh pulls prevents the compounding feed cost of days when sick animals eat but do not gain. Understanding the behavioral signals that precede clinical illness is what makes early pull decisions possible. Our guide on signs of stress in cattle covers the visual and behavioral cues to watch for during pen checks.
Feedlot Rations for Beef Cattle
Ration energy density is the primary lever for feed conversion ratio for beef cattle in the finishing phase. High-energy rations built around steam-flaked corn drive faster daily gain at better FCR than lower-energy alternatives.
Research from the University of Minnesota Extension shows that including wet distillers grains (WDG) in feedlot rations for beef cattle can reduce dry matter needed per pound of gain by up to 17% compared to straight corn grain diets in some formulations. That response is sensitive to inclusion rate and silage levels, so it requires testing against your specific commodity costs and ration specs.
The step-up program from receiving ration to finishing ration also affects FCR across the whole period. A proper 21 to 28-day transition gives the rumen time to adapt. Rushing the step-up increases acidosis risk and suppresses DMI at the point in the period when cattle should be ramping up intake. That cost shows up in the period-level FCR, not just the early days.
Ionophores
Ionophores are one of the highest-value tools in feedlot rations for beef cattle. A meta-analysis by Duffield et al. (2012), summarized by Oklahoma State University Extension, found that monensin improved feed efficiency by 6.4% across 64 experiments covering over 10 years of feedlot data. The mechanism is a shift in rumen fermentation toward propionate production, which delivers more usable energy per pound of DM consumed.
That 6.4% improvement on a 6.5:1 starting FCR reduces feed conversion ratio for cattle by roughly 0.4 points. At $350 per ton of ration, 0.4 points of FCR improvement across a 500-head pen finishing in 150 days translates to approximately $9,000 to $11,000 in recovered feed cost.
Growth Implants
Implants consistently improve feed conversion ratio for beef cattle in the finishing phase. Research reviewed by Kansas State University’s Beef Cattle Institute found that growth implants can increase average daily gain by 10% to 20% and improve feed efficiency by up to 10%. South Dakota State University Extension reports an average FCR improvement of approximately 9% from a properly designed and timed implant protocol.
Implants increase protein synthesis and muscle deposition. They do not improve digestibility of the ration. The FCR improvement comes from more gain being deposited per unit of DMI, not from the animal eating less.
Bunk Management
Bunk management is the daily decision point for feed conversion ratio for cattle. Overfeeding leads to feed waste and slug-feeding behavior. Underfeeding limits DMI and slows daily gain. Both push FCR in the wrong direction, in different ways.
A structured bunk scoring system, where pen riders score leftover feed on a 0 to 4 scale and adjust tomorrow’s delivery accordingly, keeps cattle on a consistent plane of nutrition. Inconsistent delivery is one of the most common silent causes of poor FCR across pens. The cost compounds daily and usually shows up in the closeout as unexplained variation between pens on the same ration.
Breed and Genetics
Angus and Angus-cross cattle tend to show better finishing-phase FCR than late-maturing Continental breeds, partly because they reach fat endpoint sooner and their feed conversion improves as they approach finish. British breeds also tend toward lower residual feed intake (RFI), which is the genetic measure that isolates biological efficiency from growth rate. Beef Research Canada summarizes that feed efficiency improved 4% with ionophores, 10% with implants, and 14% with beta-agonists, showing how the tools stack on top of genetic baseline performance.
Feed Conversion Ratio for Cattle vs. Residual Feed Intake: What Is the Difference?
Feed conversion ratio for cattle and residual feed intake (RFI) both measure feed efficiency but answer different questions.
FCR tells you how many pounds of feed it took per pound of gain at the pen level. It is the practical, field-level tool because it uses data you already collect: feed delivered and weight at closeout.
RFI measures how much an individual animal consumed relative to what a statistical model predicts it needs for its actual body size and growth rate. A negative RFI animal ate less than expected and is biologically efficient. A positive RFI animal ate more than expected.
For daily feedlot management and closeout analysis, FCR is the right metric. For breeding decisions and genetic selection, RFI is more precise because it separates feed intake from body size and growth rate effects. The two measures are not interchangeable, and using RFI language to describe pen-level FCR results creates confusion.
Cost of Gain Cattle: How Feed Conversion Ratio Connects to Profitability
Cost of gain cattle is the dollar cost of producing each pound of live weight gain. Feed conversion ratio for cattle is the primary driver of the feed portion of that cost.
Feed cost of gain = FCR × feed cost per lb DM
If your ration costs 180perton(0.09/lb DM) and your pen FCR is 6.5:1: Feed cost of gain = 6.5 × $0.09 = $0.585/lb
If that pen’s FCR improves to 6.0:1 at the same feed price: Feed cost of gain = 6.0 × $0.09 = $0.540/lb
On a pen that gains 45,000 lbs total, the difference between those two FCR outcomes is $2,025 in feed cost for that pen alone. That is before accounting for any reduction in days on feed at the better FCR.
Total cost of gain cattle also includes purchase cost of the animal, yardage, interest on operating capital, health expenses, and freight. But as reported by the University of Nebraska-Lincoln Extension, feed typically represents 60 to 70% of total livestock production costs, which is why feed conversion ratio for cattle sits at the center of every closeout conversation.
Feedlot Rations for Beef Cattle and FCR: Three Variables to Watch
Feedlot rations for beef cattle in the finishing phase are typically built around steam-flaked corn as the primary energy source, with wet distillers grains, corn silage, roughage, and a supplement pack rounding out the ration. Three ration variables most directly affect feed conversion ratio for cattle:
Energy density: Higher net energy for gain (NEg) values in the ration drive better FCR at the same DMI. Steam-flaked corn consistently outperforms dry-rolled corn in NEg, which is why it is standard in most large commercial feedlot operations running tight FCR targets.
Roughage level: Roughage is necessary for rumen health, but each percentage point of roughage added above the floor reduces energy density and raises FCR slightly. Finding the minimum effective roughage level without triggering acidosis is a nutritionist’s decision, not a driver’s.
Trace minerals and supplement pack: The mineral and vitamin component of the ration affects rumen microbial efficiency and immune function, both of which connect directly to FCR. Our guide on minerals for cattle covers the key roles trace minerals play in cattle performance and feed utilization.
Moisture from WDG or silage: High-moisture ingredients suppress apparent as-fed intake while delivering similar DM. If feed delivery records are tracked on an as-fed basis only, FCR will look artificially good on high-WDG rations. Always verify calculations on a DM basis.
Managing weight gain effectively in the finishing phase ties directly to these ration decisions. Our livestock fattening guide covers the weight gain principles that connect to ration formulation in the finishing phase. The strategy also carries forward from how cattle were raised before arrival. Preconditioned cattle that received a grain introduction before feedlot entry reach peak DMI faster, which shows up in early-period FCR. Our guide to preconditioning calves covers this phase in detail.
Tracking Feed Conversion Ratio for Cattle Across Pens During the Feeding Period
Many feedlot operations calculate feed conversion ratio for cattle at closeout only. That is too late to act on. Monitoring feed conversion ratio for cattle at the pen level during the feeding period gives you time to respond.
Weekly pen-level FCR estimates, calculated from bunk delivery records and gain estimates based on published weight curves for the cattle type, give you a directional signal mid-period. A pen tracking at 7.5:1 in week eight of a 150-day period gives you time to investigate before the numbers are final.
What to look for when mid-period FCR is running high:
- Feed delivery weights not matching ration specs (driver error compounds daily)
- Pen-level feed refusals signaling a health problem that morning checks missed
- Gain estimates tracking below the expected curve for the placement weight class
- Ration DM content that has drifted from spec due to silage moisture variation
Accurate cattle inventory tracking is the foundation for reliable FCR calculations. Feed conversion ratio for cattle is only as accurate as your headcounts, weights, and feed delivery records. Centralizing pen records, feed delivery logs, and health event data makes mid-period FCR tracking practical. Without it, you are working from the wrong end of the feeding period. That is exactly what purpose-built feedlot management software is built to solve. Cattlytics connects EID records, daily pen activity, and feed delivery data so you can track FCR trends in real time and act before the closeout tells you it is too late.
FAQs
What is feed conversion ratio for cattle?
Feed conversion ratio for cattle is the number of pounds of dry matter consumed per pound of live weight gained. It is calculated as total pen DM intake divided by total pen weight gain, expressed as a ratio such as 6.5:1.
What is a good average feed conversion ratio for beef cattle in the finishing phase?
The average feed conversion ratio for beef cattle on high-grain finishing rations runs 6.0 to 6.5:1 in commercial feedlots. A pen finishing at 5.5:1 is performing well. A pen above 7.5:1 in the finishing phase warrants investigation into health events, bunk management, or ration delivery accuracy.
What is the difference between feed conversion ratio and cost of gain for cattle?
Feed conversion ratio for cattle measures feed efficiency (feed per pound of gain). Cost of gain cattle is a dollar figure that incorporates FCR, feed price, yardage, health costs, and other charges. FCR is the primary driver of feed cost of gain, which typically makes up 60 to 70% of total cost of gain in high-energy finishing programs.
Why is feed conversion ratio for cattle worse during the receiving phase?
Receiving-phase FCR is high by design. Stressed animals suppress feed intake while their immune systems activate, and receiving rations are lower in energy than finishing rations. An FCR of 8.0 to 10.0:1 in the first 14 to 21 days is expected. The priority in receiving is health, not efficiency.
Do growth implants improve feed conversion ratio for beef cattle?
Yes. Research reviewed by Kansas State University’s Beef Cattle Institute found implants improve feed efficiency by up to 10% in the finishing phase. South Dakota State University Extension reports an average FCR improvement of approximately 9% from a well-designed implant protocol.
How does breed affect feed conversion ratio for cattle?
Breed affects FCR through differences in maturity rate, fat deposition patterns, and biological feed efficiency. British breeds like Angus tend to show better finishing-phase FCR than later-maturing Continental breeds at the same stage of finish. Residual feed intake (RFI) is the genetic measure that isolates biological efficiency from growth rate effects.